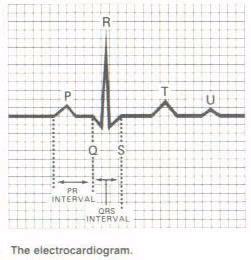
ECG basics: there are 4 components:
p wave, the QRS complex, the t-wave, and the u-wave. We will leave out discussion of the u-wave at this time. This is the electrical pattern that causes the mechanical action of the heart to beat. These are the components we will monitor and measure.
The smallest boxes represent 0.04 seconds. Five of these make up a larger box that represents 0.20 seconds. Five of the larger boxes represent 1 second, see left.
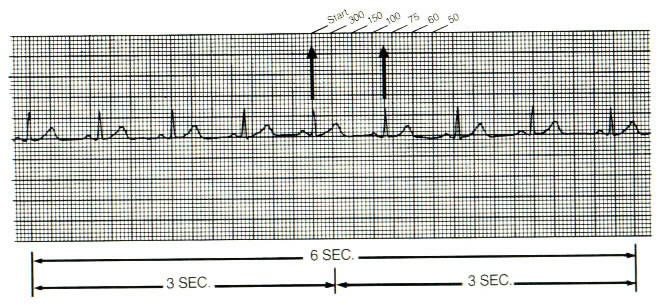
Each strip will be shown as a 6 second strip as shown below. From red mark to red mark is 1 second
(5 larger boxes).
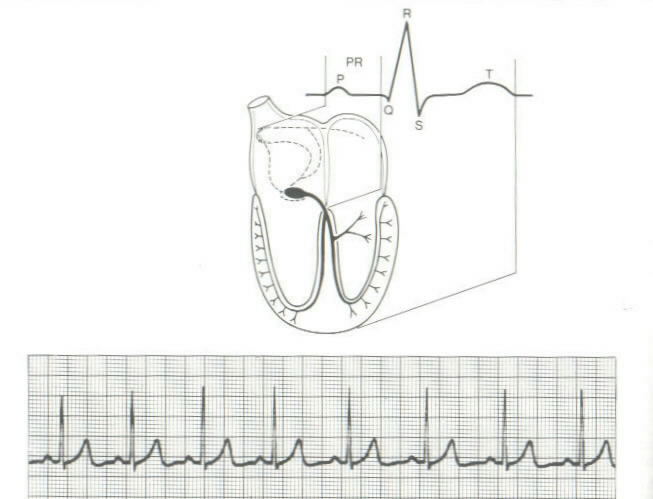
Next picture shows the mechanical heart showing the equivalent in the electrical pattern.
SA Node starts the pacemaker beat. This is the start of the P-wave. The PR interval is from the SA node through the AV node and stops at the Bundle Branches. The QRS complex
shows the ventricular beat
through the Bundle
Branches to the perkinje
fibers. The T wave is the
repolarization of the
ventricules. This is why we
do not want to see another
QRS complex on the T wave.
You may or may not see a
U-wave. Best seen in
V3, under normal
conditions. If prominent, it can indicate some disease processes like hypokalemia.